MTR is a powerful tool that enables administrators to diagnose and isolate networking errors and provide reports of network status to upstream providers. MTR describes the traceroute command's evolution by providing a greater data sample as if augmenting traceroute with ping output.
Networking diagnostic tools including ping, traceroute, and mtr use Internet Control Message Protocol (ICMP) packets to test contention and traffic between two points on the Internet. When a user pings a host on the Internet, many ICMP packs are sent to the host, acknowledging by sending reply packets. The user's client can then calculate the round trip time between two points on the Internet.
How to install the MTR software and how to interpret the results given by this tool?
Steps for installation of MTR.
> For Linux
Debian/Ubuntu
apt update && apt upgradeapt install mtr-tiny
CentOS/RHEL/Fedora
yum updateyum install mtr
> For Windows
There is a port of MTR called “WinMTR”. You can download this application from the WinMTR upstream.
> For macOS
Install MTR on macOS with either Homebrew or MacPorts. To install MTR with Homebrew, run:brew install mtr
To install MTR with MacPorts, run:port install mtr
How to Generate an MTR Report?
MTR is a directional tool, and it gives an image of the route traffic takes from one host to another. The route taken between two points on the Internet can fluctuate significantly based on location and the routers located upstream. For this reason, it is an excellent concept to get MTR reports in both ways for all hosts that are undergoing connectivity issues.
When relating to MTR reports, this article describes the host running mtr as the source host and the host targeted by the question as to the destination host.
On Unix-based Systems
For generating MTR reports, run the below-given syntax:
mtr -rw [destination_host]
To test the route and connection quality of traffic to the destination host -test.com:
mtr -rw test.com
On Windows Systems
Running MTR on Windows uses a GUI. Open WinMTR, type the destination host in the box as mentioned, and choose the start option to generate report data.
Read MTR Reports
Because MTR reports include a great deal of data, they can be challenging to understand at first. We are giving a report from a local connection to google.com:
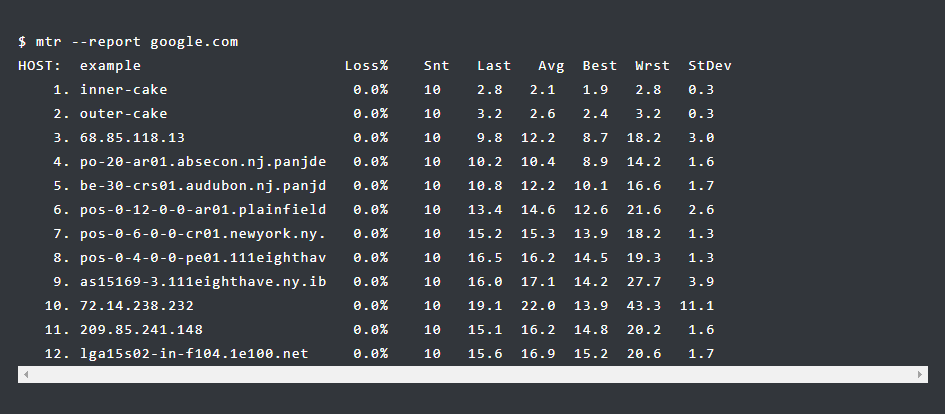
The report has been generated with mtr --report google.com. Without the 'report' option, mtr will run continuously in an interactive environment. The interactive mode displays current round trip times to each host. In most cases, the 'report' mode gives adequate data in a helpful format.
Each counted line represents a hop. Hops are the Internet nodes through which the packets pass to get to their destination. Reverse DNS lookups determine the names for the hosts (e.g. "inner-cake" and "outer-cake" in the example). If you need to omit the rDNS lookups, you can use the '--no-dns' option, which generates output similar to the following:
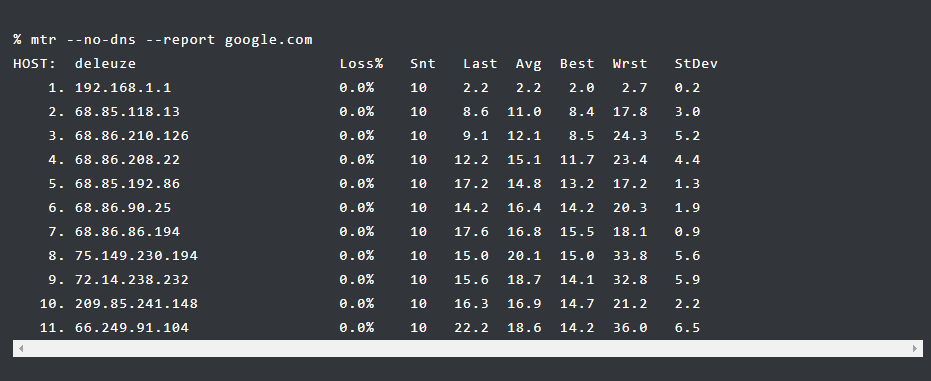
MTR provides valuable statistics concerning the stability of that connection in seven columns that are given below.
>The 'Loss%' column shows the percentage of packet loss at each hop.
>The 'Snt' column includes the number of packs mailed. The --report option will send ten packets unless specified with --report-cycles=[number-of-packets], where 'number-of-packets' indicates the total number of packets you want to send to the remote host.
The Last, Avg, Best, and Wrst includes latency measurements in milliseconds.
>The 'Last' is the latency of the previous packet sent, and 'Avg' is the average latency of all packets.
>The 'Best' and 'Wrst' shows the best and worst performance trip time for a packet to this host.
>The final column, 'StDev', represents the standard deviation of the latencies to each host. The higher the standard deviation, the greater the difference is between measurements of latency. The standard deviation enables you to assess if the mean (average) provided represents the true centre of the data set or skewed by some phenomena or measurement error. If the standard deviation is high, the latency measures were changeable. After averaging the latencies of the ten packets sent, the average looks normal but may, in fact, not represent the data very well. If the standard deviation is high, take a look at the best and worst latency measurements to ensure the average is a good representation of the actual latency and not the result of too much fluctuation.
In most cases, you may consider the MTR output in three main sections. Depending on arrangements, the first 2 or 3 hops often represent the source host's ISP, while the last 2 or 3 hops represents the destination host's ISP.
The hops in between are the routers the packet crosses to reach its destination.
How to analyze MTR Reports?
Verify packet loss
When examining MTR output, you are looking for two things: loss and latency. If you see a percentage of loss at any particular hop, that may indicate a problem with that specific router. However, it is common practice amongst some service providers to rate-limit the ICMP traffic that MTR uses. This can give the illusion of packet loss when there is, in fact, no loss. To learn if the thrashing you’re seeing is actual or due to rate limiting, take a look at the subsequent hop. If that hop shows a loss of 0.0%, then you likely see ICMP rate limiting and not actual loss:

In this case, the loss reported between hops 1 and 2 is likely due to rate limiting on the second hop. Although traffic to the remaining eight hops all reach the second hop, there is no packet loss. If the loss continues for more than one hop, there is some packet loss or routing issues. Remember that rate-limiting and loss can happen concurrently. In this case, take the lowest percentage of loss in a sequence as the actual loss:

There is a 60% loss between hops 2 and 3 and between hops 3 and 4. You can find that the third and fourth hop is likely to lose some traffic because no succeeding host reports zero loss. However, some of the loss is due to rate limiting as several of the final hops are only enduring 40% loss. When various amounts of loss are reported, always trust the reports from later hops. Problems in the return route can also explain some loss. Packets will reach their goal without error but have a difficult time making the return trip. For this reason, it is often best to collect MTR reports in both directions when you’re experiencing an issue.
Network Latency
In addition to helping you assess packet loss, MTR will also help evaluate the latency of a connection between your host and the target host.
By physical restrictions, latency always increases with the number of hops in a route. However, the increases should be consonant and straight. Unfortunately, latency is often relative and depends on the quality of both host’s connections and physical distance. When evaluating MTR reports for potentially problematic links, consider earlier fully functional reports as the context in addition to available connection speeds between other hosts in a given area. The connection status may also influence the amount of latency you experience for a particular route. Predictably, dial-up connections will have much greater latency than cable modem connections to the same destination.
The following MTR report shows a high latency:

The amount of latency dives significantly between hops 3 and 4 and rests high. This may point to a network latency issue as round trip times remain high after the fourth hop. This report is difficult to discover the cause, although a saturated peering session, a poorly configured router, or a blocked link are many causes.
In the above example, while there is a significant jump in latency between hosts 3 and 4, the latency does not grow surprisingly in any following hops. Of this, it is logical to think that there is some issue with the 4th router. ICMP rate limiting can also produce the form of latency, similar to the way that it can make the presence of packet loss.
At first sight, the latency between hops 4 and 5 brings awareness. But, after the fifth hop, the latency drops drastically. The actual latency included here is about 40ms. In cases like this, MTR brings attention to a problem that does not change the service. Analyze the latency to the final hop when assessing an MTR report.

What are the common MTR reports?
Several common MTR reports describe common networking issues. If you’re facing some networking issue and require to diagnose your problem, consider the following examples.
1) When Destination Host Networking Improperly Configured
The below example shows a 100% loss to the destination host because of a wrongly configured router. At first glance, the packets are not stretching the host, but this is not the case.

The traffic does give the destination host. However, the MTR report points loss because the destination host is not giving a reply. This may result from improperly configured networking or firewall rules that cause the host to drop ICMP packets.
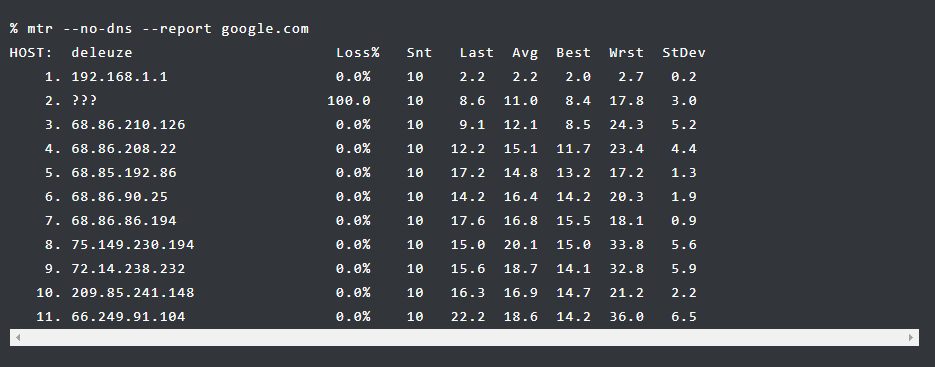
2) Residential or Business Router
Residential gateways sometimes cause misleading reports. In the below example, the 100% loss reported at the second hop does not mean a problem. You can see that there is no loss on consequent hops.
3) When an ISP Router Is Not Configured Properly
Sometimes a router on the route your packet takes is wrongly configured, and your packets may never reach their destination:
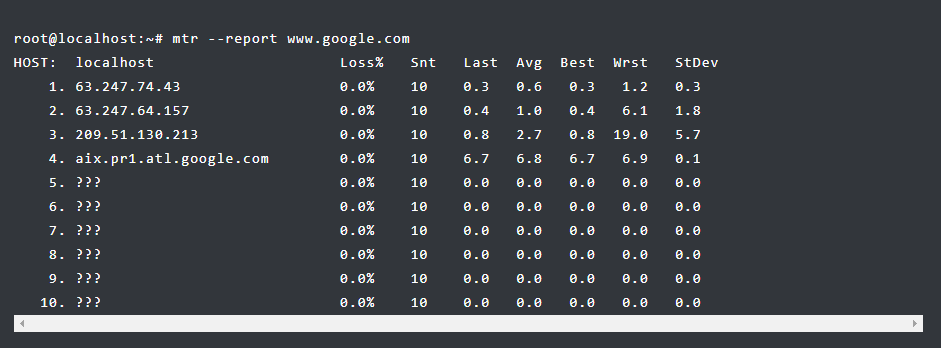
The question marks arise when there is no further route knowledge. Sometimes, a poorly configured router will send packets in a loop.
4) ICMP Rate Limiting
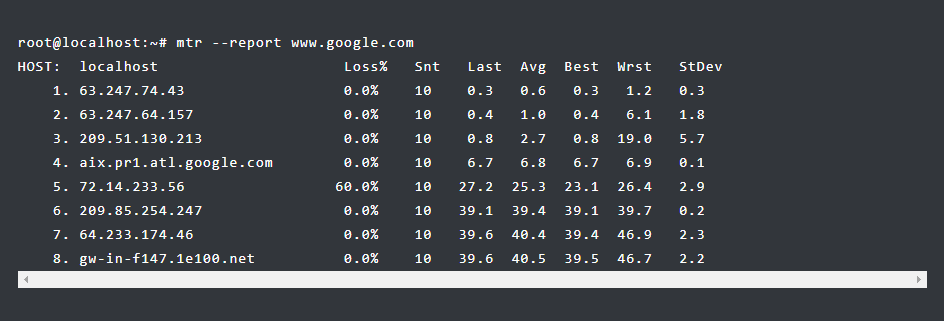
ICMP rate limiting can make potential packet loss. When there is packet loss to one hop that doesn’t continue to subsequent hops, the loss is caused by ICMP limiting.
This report does not show a cause for concern. Rate limiting is a common practice, and it decreases excess to prioritize more critical traffic.
See the following example:
5) Timeouts
Timeouts can occur for various reasons. Some routers will discard ICMP, and absent replies will be shown on the output as timeouts. Alternatively, there may be a difficulty with the return route:

Timeouts are not certainly an implication of packet loss. Packets still reach their destination without significant packet loss or latency.
Advanced MTR techniques
Newer versions of MTR are now proficient in TCP mode on a named TCP port than the default use of the ICMP protocol. However, in most cases, this mode shouldn’t be used as TCP reports can be deceiving in diagnosing inter-route issues. A TCP MTR will use SYN packets in place of ICMP pings, and most internet-level routers will not respond to these, erroneously showing a loss.
A TCP test helps determine whether firewall rules on a router somewhere are blocking a protocol or port, perhaps because port forwarding has not been appropriately configured. Running a TCP test over a specific port could show this, whereas an ICMP test may not.
Running MTR in TCP mode will require super-user privileges on most machines:
sudo mtr --tcp --port 80 --report --report-cycles 10 speedtest.dallas.test.com
sudo mtr --tcp --port 22 --report --report-cycles 10 50.116.25.154
Resolve Routing and Networking Issues Identified in your MTR report
In most cases, by the time you notice a problem with a route, the Internet service provider’s monitoring has already reported the problem, and administrators are working to fix the issue. In situations where you are feeling wicked service for an extended period, you may choose to inform a provider of your experiencing issues.
When contacting a service provider, send MTR reports and any other relevant data you may have. Without usable data, providers have no way to verify or fix problems.


