Updated: 3 November 2026 · Applies to: vtop 0.6.1, tested on Node.js 22 (Debian/Ubuntu and AlmaLinux)
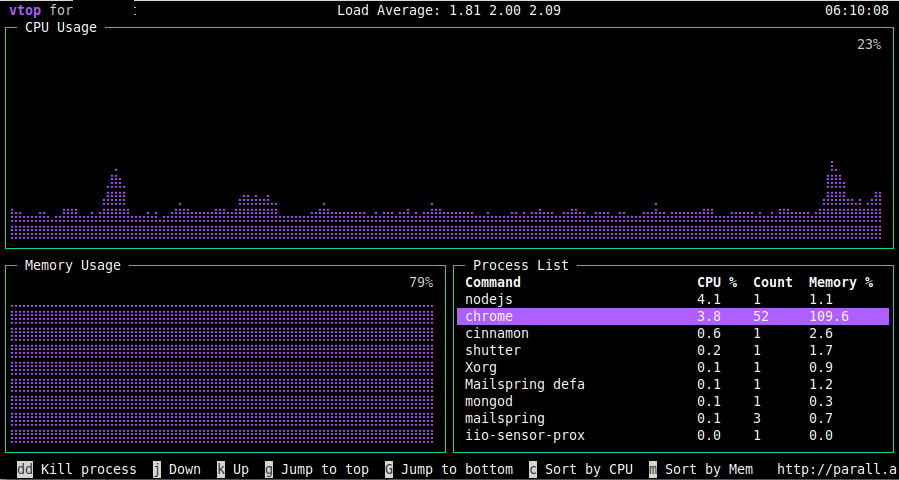
vtop is a free, open source terminal tool that draws your server's CPU and memory usage as live graphs, using Unicode braille characters, instead of the plain numbers a tool like top gives you. It also groups a multi-process application's master and child processes together, for example Nginx, Apache or Node.js, so you see one combined CPU and memory figure per application instead of a long list of separate PIDs.
Is vtop still worth installing?
vtop's last release on npm, version 0.6.1, was published on 6 September 2018, and the project has had no update since. Installing it today still works: we tested npm install -g vtop on a current Node.js 22 LTS server on the date above, and it installed and ran correctly on both Debian/Ubuntu and AlmaLinux. npm does print a security warning for one of vtop's older dependencies, glob@7.1.2, which npm's own installer flags as carrying known vulnerabilities, so treat vtop as a read only monitoring convenience rather than something to run long term on a security sensitive box. If you want an actively maintained alternative with a similar live graph interface, htop, already in every distribution's package manager, or btop are both still developed today.
Requirements
vtop needs Node.js and npm. If your server does not already have them, install the current version for your distribution.
On Debian or Ubuntu:
curl -fsSL https://deb.nodesource.com/setup_22.x | bash -
apt install -y nodejs
On AlmaLinux, Rocky Linux or RHEL:
dnf install -y nodejs
Check that both commands worked:
node --version
npm --version
Installing vtop
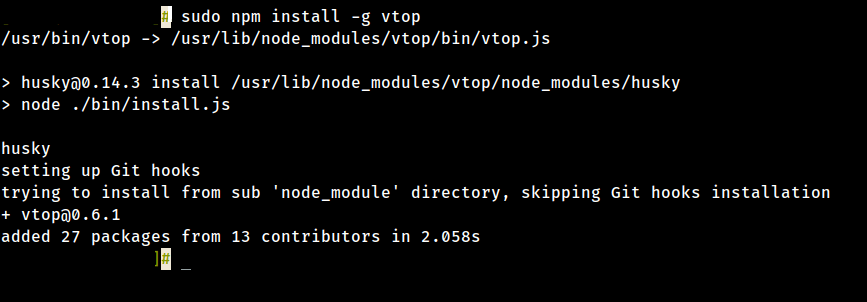
Once Node.js and npm are ready, install vtop globally. Use sudo if your account needs it for global npm installs.
sudo npm install -g vtop
Launching vtop
Run it with:
vtop
Keyboard shortcuts
These are read directly from vtop's own source code, so they are accurate for version 0.6.1.
- q, Esc, or Ctrl+C: quit vtop.
- k or the up arrow: move up the process list.
- j or the down arrow: move down the process list.
- h or the left arrow: zoom the graphs in.
- l or the right arrow: zoom the graphs out.
- g: jump to the top of the process list.
- G: jump to the end of the process list.
- c: sort the process list by CPU.
- m: sort the process list by memory.
- dd: kill every process in the selected group. Select the process name first, then press d twice.
- u: update vtop to the latest version available.
Command line options
vtop also takes a few flags, confirmed against its own vtop -h output.
-t, --theme <name>: set the colour theme. The available themes are acid, becca, brew, certs, dark, gooey, gruvbox, monokai, nord, parallax, seti and wizard.--no-mouse: turn off mouse interaction.--update-interval <milliseconds>: how often the graphs refresh.--quit-after <seconds>: exit on its own after this many seconds, useful for a quick check from a script.-V, --version: print the installed version.-h, --help: print this list of options.
For example, to run vtop with the wizard theme:
vtop --theme wizard
To refresh the graphs every 20 milliseconds instead of the default:
vtop --update-interval 20
To have vtop exit on its own after 5 seconds:
vtop --quit-after 5
vtop's source is on GitHub if you want to read it yourself before running it on a production server.
